Attribute 1 Renewable Energy Sources:
(1) Wind farms: A group of wind turbines in the same place, producing electricity. This study is focusing on onshore (terrestrial) wind farms located on fields or hills.
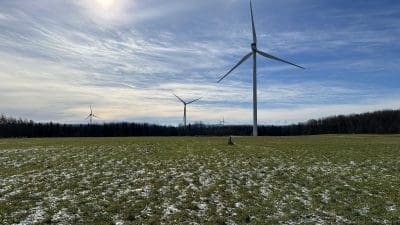 Noble Ellenburg Wind Park, Clinton County, New York (54 Turbines - 81 MW). The first turbine is 0.18 miles (978.1 ft), Second 0.50 miles, Third 1 mile away, and the turbines behind trees 1.6 to 2.7 miles away from the road
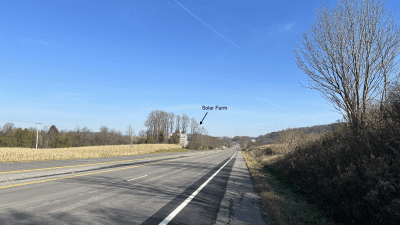
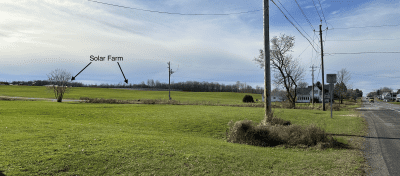
(2) Solar farms: A group of solar PV panels placed on farms on the ground in an open space to capture the energy from the sun and convert it into electricity. We are not referring to rooftop solar installations.
 Solar farm 0.20 miles away
Attribute 2 Landscape – Visual Impact:
The visual impact can be defined as the effect that the renewable energy facility has on nearby views from your community under good daytime visibility conditions. We will ask you to consider three levels of visual impact as follows.
The visual impact of wind farms:
(1) Low Impact: You can rarely see the wind turbines, or they provide minimal impact on the viewshed.
 Munnsville Wind Project, Madison County, NY (23 Turbines - 34.5 MW). Turbines are on hills 4.5 miles away from the road
(2) Moderate Impact: You can see some of the wind turbines.
 Noble Chateaugay Wind Park, Franklin County, NY (71 Turbines - 106 MW). Turbines 1.3 to 2.1 miles away from the road
(3) Major Impact: You can clearly see many wind turbines.

Noble Chateaugay Wind Park, Franklin County, NY (71 Turbines - 106 MW). The first big turbine is 0.2 miles away, and behind that 0.3 to 1.2 miles away from the road.
The visual impact of solar farms:
(1) No Impact: You cannot see the solar farm even if it is close to your property or a road. [Solar collection devices tend to be only about 10 feet tall and solar farms are often surrounded by trees, so that the visual impact of the solar farm on the nearby community is quite minor.]

 Solar farm behind trees, and it is 0.22 miles away from the road.
 Solar farm 0.26 miles away from the road.
(3) Moderate Impact: The solar farm is largely visible from points in your community and not substantially obstructed from view by other obstacles.

Solar farm 0.48 miles away from the road.
Attribute 3 Impact on Agricultural Production:
Sometimes people lease sections of farmland to wind or solar development companies instead of using that land for agriculture. Wind turbine installation areas usually range between 10 to 20 acres for 50 to 100 turbines. Similarly, solar farms require a substantial area of land.
This study asks you to consider that various wind and solar projects will impact acres of agriculture land as follows:
Wind farm project area: 10 acres, 15 acres, or 20 acres
Solar farm project area: 50 acres, 100 acres, or 150 acres
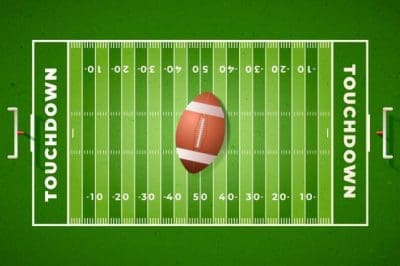
How big is an acres - a unit frequently used to measure land? Imagine a standard American football field, which is commonly measured at 1.32 acres.
Attribute 4 Distance from your residence:
This means how far wind or solar farms are installed from your property.

This study considers distance as follows:
Wind Farm: 0.5, 1, 3, or 5 miles.
Solar Farm: 0.1, 0.2, 0.3, or 0.4 miles.